
 Viết ít nhất 150 từ trong khoảng 20 phút.
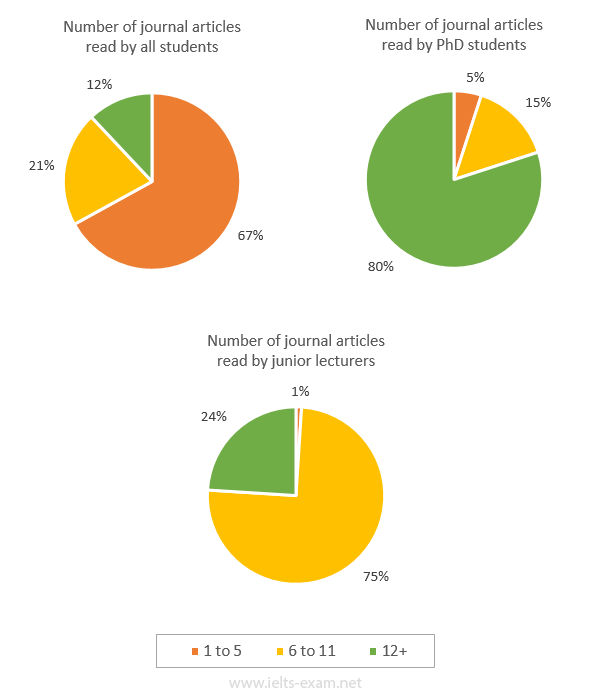
The pie charts show how many journal articles were read per week by all students, PhD students and junior lecturers at a university in Australia. The articles are divided into three groups: 1 to 5, 6 to 11 and 12 or more.
Overall, most students read only 1 to 5 articles per week, while most PhD students read 12 or more. Junior lecturers mostly read between 6 and 11 articles.
For all students, 67% read 1 to 5 journal articles each week, which was the biggest group. 21% read 6 to 11 articles, and only 12% read 12 or more articles.
PhD students read much more than other students. 80% of them read 12 or more articles per week, while 15% read 6 to 11 articles and just 5% read 1 to 5 articles.
For junior lecturers, three quarters, 75%, read 6 to 11 articles a week. 24% of them read 12 or more, and only 1% read 1 to 5 articles. So, PhD students read the most articles of the three groups.