IELTS Writing Task 1 · Pie chart

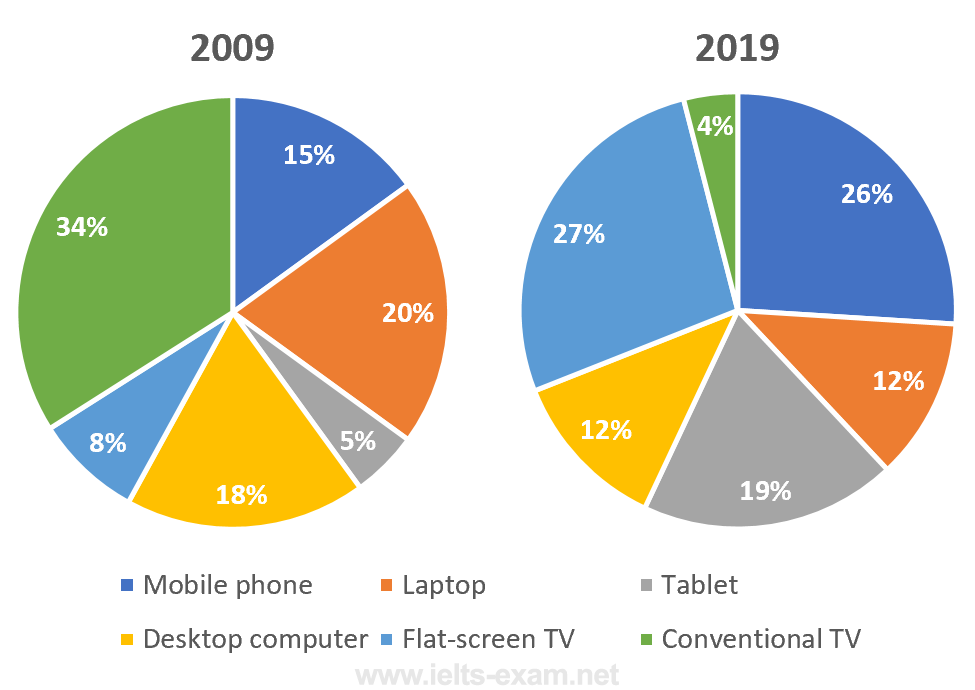
Bài mẫu IELTS Writing Task 1: The pie charts below show the devices people in the 18 to 25 age group use to watch television in Canada in two different years.

Biểu đồ tròn 20 phút · tối thiểu 150 từ Bài mẫu 6.0 Bài mẫu 7.0 Bài mẫu 9.0 trong app

Đề bài

The pie charts below show the devices people in the 18 to 25 age group use to watch television in Canada in two different years.

Summarise the information by selecting and reporting the main features, and make comparisons where relevant.

IELTS Writing Task 1 Pie chart: The pie charts below show the devices people in the 18 to 25 age… Viết ít nhất 150 từ trong khoảng 20 phút.

Dàn ý gợi ý cho dạng Pie chart

Xem tất cả đề dạng Pie chart →

Biểu đồ tròn thể hiện tỷ lệ các phần trong một tổng. Thường có 2–3 biểu đồ để so sánh giữa các năm hoặc các nhóm.

  1. Mở bàiParaphrase đề: tỷ lệ của cái gì, ở nhóm/năm nào.
  2. OverviewPhần chiếm tỷ trọng lớn nhất và thay đổi lớn nhất giữa các biểu đồ.
  3. Thân bài 1Các phần lớn, so sánh giữa các biểu đồ.
  4. Thân bài 2Các phần nhỏ hoặc thay đổi đáng chú ý.
  • Đa dạng cách nói tỷ lệ: a quarter, just under half, the vast majority.
  • Dùng account for, make up, constitute thay cho is.
  • Không cộng dồn hay suy diễn số liệu không có trên biểu đồ.

Bài mẫu band 6.0

163 từ. Bài đủ ý, bố cục rõ, từ vựng và ngữ pháp ở mức an toàn: đây là mức nhiều bạn cần để đạt mục tiêu 6.0.

The pie charts show the devices that people aged 18 to 25 in Canada used to watch television in 2009 and 2019.

Overall, conventional TV was the most popular device in 2009, but it became the least popular in 2019. In contrast, flat-screen TVs, mobile phones and tablets became much more popular over the ten years.

In 2009, 34% of young people watched television on a conventional TV, which was the biggest percentage. Laptops were the second with 20%, and desktop computers had 18%. Mobile phones were used by 15% of people, while flat-screen TVs and tablets were less common, at 8% and 5%.

In 2019, the percentage of conventional TV fell sharply to only 4%. On the other hand, flat-screen TVs increased a lot to 27%, and they became the most popular device. Mobile phones also rose to 26%, and tablets went up to 19%. However, the use of laptops and desktop computers decreased, and both of them were 12% in 2019.

Bài mẫu band 7.0

176 từ. So với bài 6.0: lập luận sâu hơn, từ vựng chính xác và đa dạng hơn, câu phức dùng tự nhiên hơn.

The pie charts compare the devices used by 18- to 25-year-olds in Canada to watch television in 2009 and 2019.

Overall, there was a significant shift in viewing habits over the decade. Conventional TVs went from being the most popular device to the least popular, while flat-screen TVs, mobile phones and tablets all became considerably more common.

Còn 2 đoạn của bài 7.0 và bài mẫu band 9.0

Đăng nhập miễn phí để đọc trọn bài, so sánh 3 mức band và viết thử ngay trên đề này.

Đọc tiếp trong app