IELTS Writing Task 1 · Pie chart

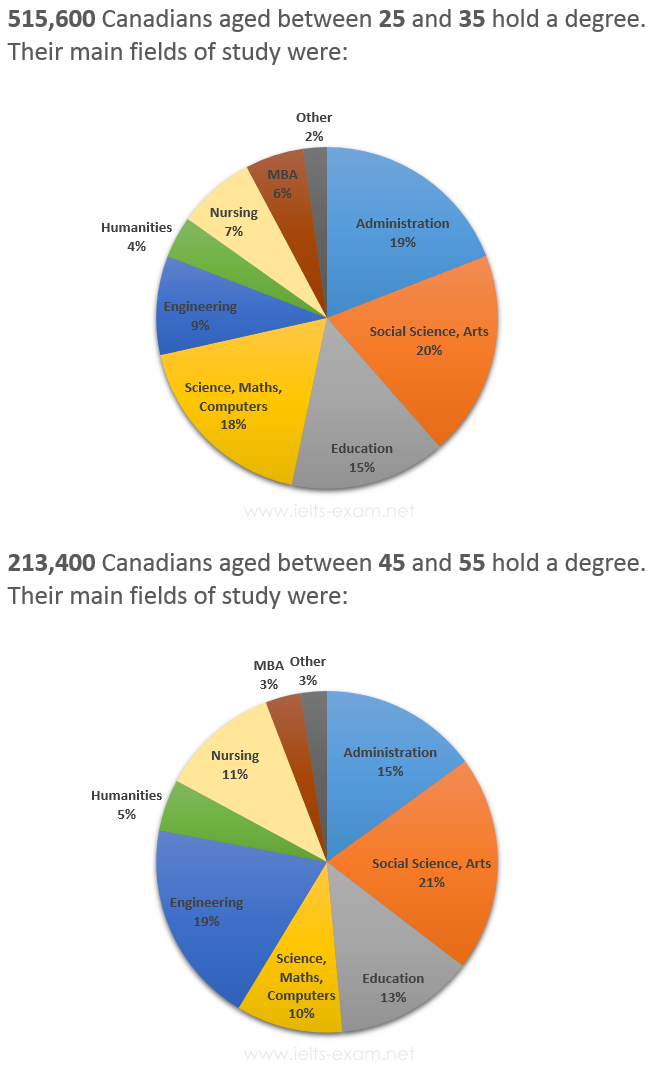
Bài mẫu IELTS Writing Task 1: The graphs below show the post-school qualifications held by Canadians in the age groups 25 to 35 and 45 to 55.

Biểu đồ tròn 20 phút · tối thiểu 150 từ Bài mẫu 6.0 Bài mẫu 7.0 Bài mẫu 9.0 trong app

Đề bài

The graphs below show the post-school qualifications held by Canadians in the age groups 25 to 35 and 45 to 55.

Summarise the information by selecting and reporting the main features, and make comparisons where relevant.

IELTS Writing Task 1 Pie chart: The graphs below show the post-school qualifications held by… Viết ít nhất 150 từ trong khoảng 20 phút.

Dàn ý gợi ý cho dạng Pie chart

Xem tất cả đề dạng Pie chart →

Biểu đồ tròn thể hiện tỷ lệ các phần trong một tổng. Thường có 2–3 biểu đồ để so sánh giữa các năm hoặc các nhóm.

  1. Mở bàiParaphrase đề: tỷ lệ của cái gì, ở nhóm/năm nào.
  2. OverviewPhần chiếm tỷ trọng lớn nhất và thay đổi lớn nhất giữa các biểu đồ.
  3. Thân bài 1Các phần lớn, so sánh giữa các biểu đồ.
  4. Thân bài 2Các phần nhỏ hoặc thay đổi đáng chú ý.
  • Đa dạng cách nói tỷ lệ: a quarter, just under half, the vast majority.
  • Dùng account for, make up, constitute thay cho is.
  • Không cộng dồn hay suy diễn số liệu không có trên biểu đồ.

Bài mẫu band 6.0

172 từ. Bài đủ ý, bố cục rõ, từ vựng và ngữ pháp ở mức an toàn: đây là mức nhiều bạn cần để đạt mục tiêu 6.0.

The pie charts show the main fields of study of Canadians with a degree in two age groups, 25 to 35 and 45 to 55.

Overall, many more younger Canadians had a degree than older Canadians. Social science and arts was one of the most popular subjects in both age groups, but there were some big differences in other subjects.

There were 515,600 people aged 25 to 35 with a degree. The most popular fields for them were social science and arts with 20%, administration with 19% and science, maths and computers with 18%. Education had 15%, while engineering, nursing, MBA and humanities had less than 10% each.

In comparison, only 213,400 people aged 45 to 55 had a degree. Social science and arts was also the most popular field with 21%, but engineering was much more popular than in the younger group, at 19%. Administration had 15% and education 13%. Science, maths and computers was only 10%, which was much lower than the younger group, while nursing was higher at 11%.

Bài mẫu band 7.0

192 từ. So với bài 6.0: lập luận sâu hơn, từ vựng chính xác và đa dạng hơn, câu phức dùng tự nhiên hơn.

The pie charts compare the main fields of study of Canadian degree holders in two age groups: 25 to 35 and 45 to 55.

Overall, the number of degree holders in the younger age group was more than twice that in the older group. Social science and arts was the most popular field among both groups, but younger Canadians were more likely to have studied administration and science-related subjects, whereas older Canadians more often held degrees in engineering and nursing.

Còn 2 đoạn của bài 7.0 và bài mẫu band 9.0

Đăng nhập miễn phí để đọc trọn bài, so sánh 3 mức band và viết thử ngay trên đề này.

Đọc tiếp trong app