
 Viết ít nhất 150 từ trong khoảng 20 phút.
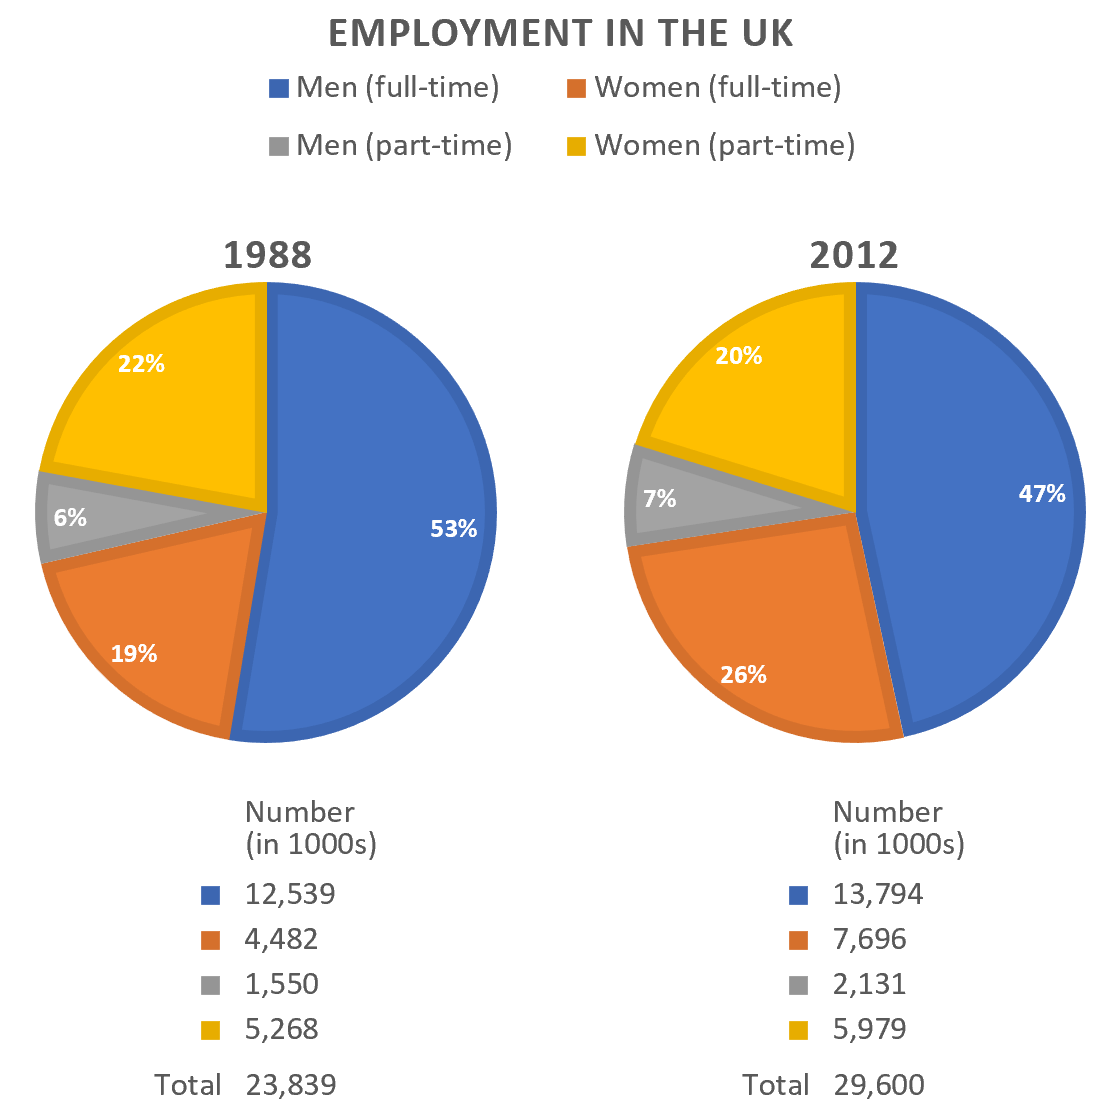
The pie charts show the employment in the UK in 1988 and 2012, divided into four groups: men and women working full-time and part-time.
Overall, full-time male workers was the largest group in both years, but their percentage decreased. The proportion of women working full-time increased, and the total number of workers also went up from about 23.8 million to 29.6 million.
In 1988, men working full-time made up 53% of all workers, with about 12.5 million people. Women working part-time was the second largest group at 22%, while women working full-time was 19%. Only 6% of workers were men working part-time.
In 2012, the percentage of full-time men fell to 47%, although the number of them rose to around 13.8 million. Full-time women increased a lot to 26%, which was about 7.7 million people. Part-time women decreased slightly to 20%, but part-time men increased a little to 7%. The number of workers in all four groups increased during the period.