
 Viết ít nhất 150 từ trong khoảng 20 phút.
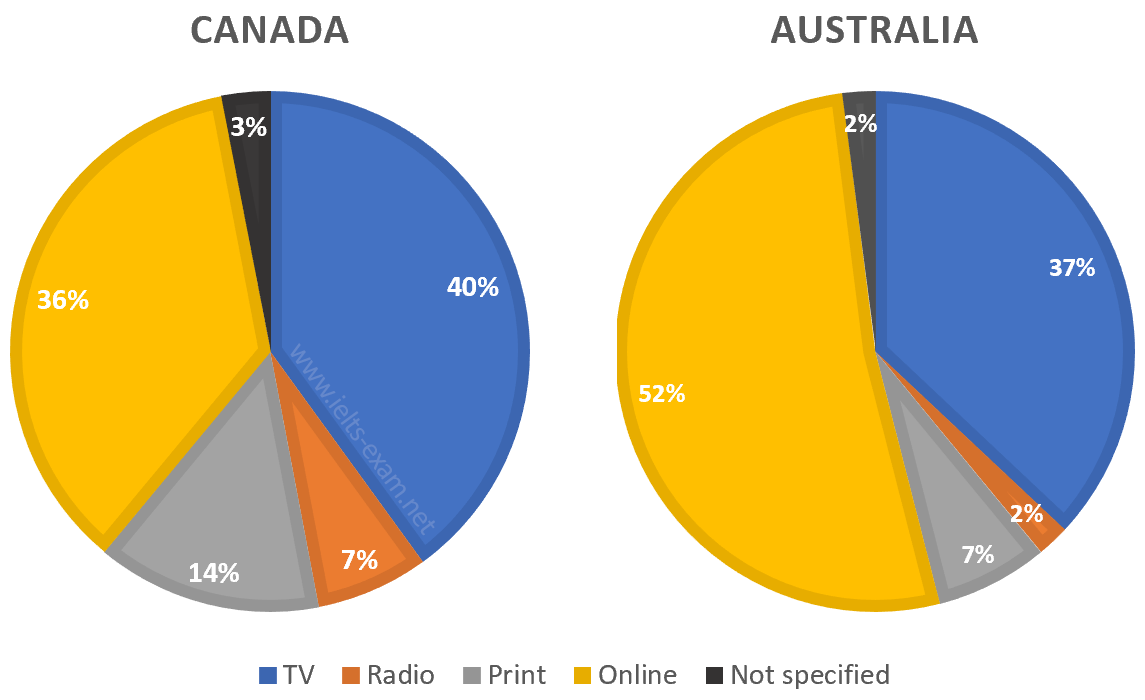
The pie charts show the different ways people in Canada and Australia get the news. The ways are TV, radio, print, online and not specified.
Overall, TV and online news were the most popular ways in both countries. In Canada, TV was the most common, but in Australia, more people got the news online.
In Canada, 40% of people watched the news on TV, which was the biggest percentage. Online news was the second with 36%. Print media like newspapers was used by 14% of people, and 7% listened to the radio. Only 3% of people did not specify how they get the news.
In Australia, online news was the most popular, at 52%, which was more than half of the people. TV was the second at 37%, slightly lower than in Canada. Print and radio was much less popular in Australia than in Canada, with only 7% and 2%. The not specified group was 2%, which was similar to Canada.