IELTS Writing Task 1 · Mixed charts

Bài mẫu IELTS Writing Task 1: Biểu đồ kết hợp #164

Biểu đồ kết hợp 20 phút · tối thiểu 150 từ Bài mẫu 6.0 Bài mẫu 7.0 Bài mẫu 9.0 trong app

Đề bài

You should spend about 20 minutes on this task.

IELTS Writing Task 1 Mixed charts: Biểu đồ kết hợp #164 IELTS Writing Task 1 Mixed charts: Biểu đồ kết hợp #164 IELTS Writing Task 1 Mixed charts: Biểu đồ kết hợp #164 Viết ít nhất 150 từ trong khoảng 20 phút.

Dàn ý gợi ý cho dạng Mixed charts

Xem tất cả đề dạng Mixed charts →

Hai biểu đồ khác loại (ví dụ cột + tròn) cùng một chủ đề. Cần mô tả cả hai và nếu có thể, chỉ ra mối liên hệ.

  1. Mở bàiParaphrase đề, nêu rõ có hai biểu đồ và mỗi cái thể hiện gì.
  2. OverviewMột ý chính cho mỗi biểu đồ.
  3. Thân bài 1Biểu đồ thứ nhất với số liệu chính.
  4. Thân bài 2Biểu đồ thứ hai, liên hệ với biểu đồ thứ nhất nếu hợp lý.
  • Chia thời gian và số chữ cân đối cho hai biểu đồ.
  • Dùng từ nối chuyển biểu đồ: Turning to, As for, Meanwhile.
  • Overview phải bao quát cả hai.

Bài mẫu band 6.0

202 từ. Bài đủ ý, bố cục rõ, từ vựng và ngữ pháp ở mức an toàn: đây là mức nhiều bạn cần để đạt mục tiêu 6.0.

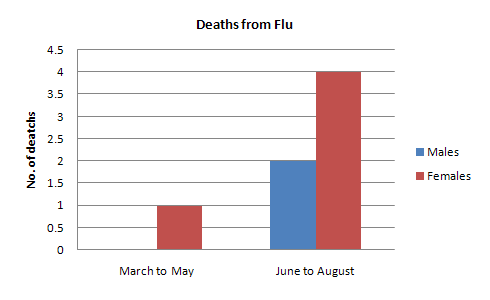
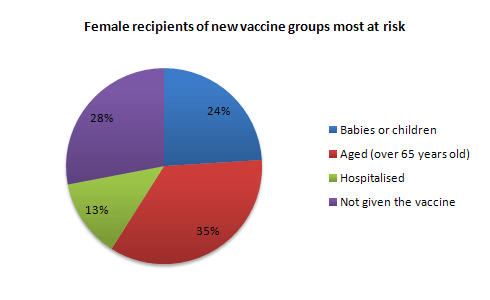
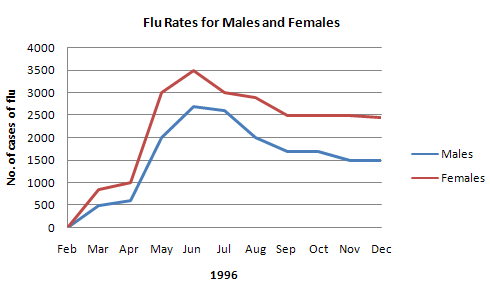
The three charts give information about flu in 1996. The line graph shows the number of flu cases for males and females, the bar chart shows the number of deaths from flu, and the pie chart shows the groups of females at risk who received a new vaccine.

Overall, females had more flu cases and more deaths than males. The number of flu cases increased quickly in spring and reached a peak in June.

In February, there were no flu cases. The number of cases increased slowly in March and April, and then rose sharply in May. In June, the number of cases reached a peak of about 3,500 for females and 2,700 for males. After that, the cases decreased, and in December there were about 2,450 cases for females and 1,500 for males.

The bar chart shows that from March to May, only one female died from flu and no males died. From June to August, 4 females and 2 males died.

The pie chart shows that 35% of the females who got the new vaccine were aged over 65, and 24% were babies or children. 13% were in hospital, and 28% of females at risk were not given the vaccine.

Bài mẫu band 7.0

206 từ. So với bài 6.0: lập luận sâu hơn, từ vựng chính xác và đa dạng hơn, câu phức dùng tự nhiên hơn.

The three charts provide information about flu in 1996: the line graph shows the number of flu cases among males and females, the bar chart shows deaths from flu in two periods, and the pie chart shows how a new vaccine was distributed among female at-risk groups.

Overall, females were more affected by flu than males, with higher numbers of both cases and deaths. Flu cases rose sharply in late spring, peaking in June, and remained relatively high for the rest of the year.

Còn 2 đoạn của bài 7.0 và bài mẫu band 9.0

Đăng nhập miễn phí để đọc trọn bài, so sánh 3 mức band và viết thử ngay trên đề này.

Đọc tiếp trong app