IELTS Writing Task 1 · Mixed charts

Bài mẫu IELTS Writing Task 1: The graphs below provide information on global population figures and figures for urban populations in different world regions.

Biểu đồ kết hợp 20 phút · tối thiểu 150 từ Bài mẫu 6.0 Bài mẫu 7.0 Bài mẫu 9.0 trong app

Đề bài

The graphs below provide information on global population figures and figures for urban populations in different world regions.

Summarise the information by selecting and reporting the main features, and make comparisons where relevant.

IELTS Writing Task 1 Mixed charts: The graphs below provide information on global population figures and… IELTS Writing Task 1 Mixed charts: The graphs below provide information on global population figures and… Viết ít nhất 150 từ trong khoảng 20 phút.

Dàn ý gợi ý cho dạng Mixed charts

Xem tất cả đề dạng Mixed charts →

Hai biểu đồ khác loại (ví dụ cột + tròn) cùng một chủ đề. Cần mô tả cả hai và nếu có thể, chỉ ra mối liên hệ.

  1. Mở bàiParaphrase đề, nêu rõ có hai biểu đồ và mỗi cái thể hiện gì.
  2. OverviewMột ý chính cho mỗi biểu đồ.
  3. Thân bài 1Biểu đồ thứ nhất với số liệu chính.
  4. Thân bài 2Biểu đồ thứ hai, liên hệ với biểu đồ thứ nhất nếu hợp lý.
  • Chia thời gian và số chữ cân đối cho hai biểu đồ.
  • Dùng từ nối chuyển biểu đồ: Turning to, As for, Meanwhile.
  • Overview phải bao quát cả hai.

Bài mẫu band 6.0

186 từ. Bài đủ ý, bố cục rõ, từ vựng và ngữ pháp ở mức an toàn: đây là mức nhiều bạn cần để đạt mục tiêu 6.0.

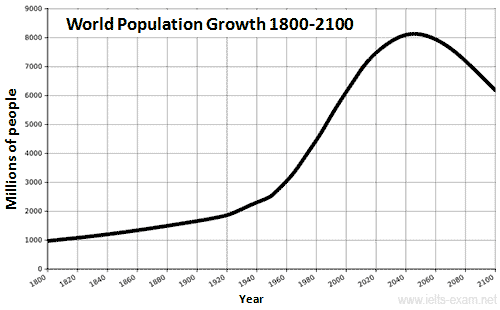
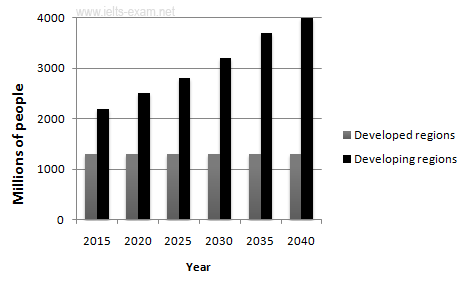
The line graph shows the world population from 1800 to 2100, and the bar chart shows the urban population in developed and developing regions from 2015 to 2040.

Overall, the world population increased a lot and is expected to reach a peak around 2050 before it falls. The urban population in developing regions is predicted to grow quickly, while in developed regions it will stay the same.

In 1800, there were about 1 billion people in the world. The population grew slowly and reached about 2 billion in the 1920s. After 1950, it increased very quickly and reached about 6 billion in 2000. It is expected to continue rising to a peak of about 8 billion in 2050. After that, the population is predicted to fall to around 6.2 billion in 2100.

The bar chart shows that the urban population in developed regions will stay at about 1.3 billion from 2015 to 2040. In contrast, the urban population in developing regions is expected to increase from about 2.2 billion in 2015 to 4 billion in 2040, which is around three times more than in developed regions.

Bài mẫu band 7.0

191 từ. So với bài 6.0: lập luận sâu hơn, từ vựng chính xác và đa dạng hơn, câu phức dùng tự nhiên hơn.

The line graph illustrates changes in the world's population between 1800 and 2100, while the bar chart compares urban populations in developed and developing regions from 2015 to 2040.

Overall, the global population grew slowly until the early twentieth century, then rose rapidly and is projected to peak around 2050 before declining. Meanwhile, urban populations in developing regions are expected to grow substantially, whereas those in developed regions are predicted to remain stable.

Còn 2 đoạn của bài 7.0 và bài mẫu band 9.0

Đăng nhập miễn phí để đọc trọn bài, so sánh 3 mức band và viết thử ngay trên đề này.

Đọc tiếp trong app