IELTS Writing Task 1 · Mixed charts

Bài mẫu IELTS Writing Task 1: The charts A and B show the share of the UK and Australian

Biểu đồ kết hợp 20 phút · tối thiểu 150 từ Bài mẫu 6.0 Bài mẫu 7.0 Bài mẫu 9.0 trong app

Đề bài

The charts A and B show the share of the UK and Australian
cinema market in 2001 and cinema admission in the UK and Australia from 1976 to
2006.

Summarise the information by selecting and reporting the main features,
and make comparisons where relevant.

IELTS Writing Task 1 Mixed charts: The charts A and B show the share of the UK and Australian Viết ít nhất 150 từ trong khoảng 20 phút.

Dàn ý gợi ý cho dạng Mixed charts

Xem tất cả đề dạng Mixed charts →

Hai biểu đồ khác loại (ví dụ cột + tròn) cùng một chủ đề. Cần mô tả cả hai và nếu có thể, chỉ ra mối liên hệ.

  1. Mở bàiParaphrase đề, nêu rõ có hai biểu đồ và mỗi cái thể hiện gì.
  2. OverviewMột ý chính cho mỗi biểu đồ.
  3. Thân bài 1Biểu đồ thứ nhất với số liệu chính.
  4. Thân bài 2Biểu đồ thứ hai, liên hệ với biểu đồ thứ nhất nếu hợp lý.
  • Chia thời gian và số chữ cân đối cho hai biểu đồ.
  • Dùng từ nối chuyển biểu đồ: Turning to, As for, Meanwhile.
  • Overview phải bao quát cả hai.

Bài mẫu band 6.0

199 từ. Bài đủ ý, bố cục rõ, từ vựng và ngữ pháp ở mức an toàn: đây là mức nhiều bạn cần để đạt mục tiêu 6.0.

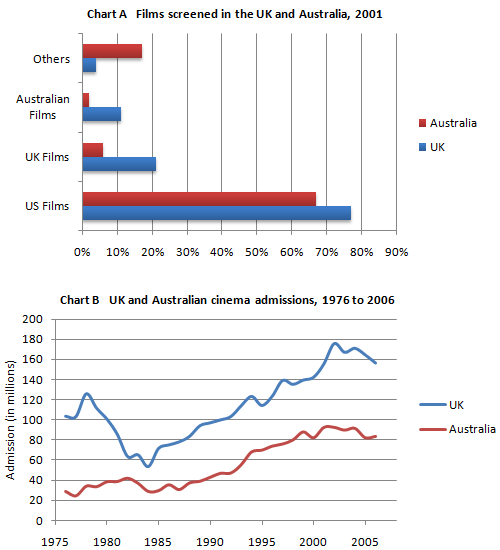
Chart A shows the percentage of films from different countries that were shown in cinemas in the UK and Australia in 2001. Chart B shows the number of cinema admissions in the two countries from 1976 to 2006.

Overall, US films were the most popular in both countries. The number of cinema admissions in both countries increased during the period, and the UK always had more admissions than Australia.

According to Chart A, US films made up 77% of films shown in the UK and 67% in Australia. In the UK, 21% of films were UK films and 11% were Australian films. In Australia, UK films were only 6% and Australian films were just 2%, while other films were 17%.

Chart B shows that in 1976, the UK had about 104 million admissions, while Australia had about 30 million. The UK figure rose to 125 million in 1978 but then fell to about 54 million in 1984. After that, it increased steadily and reached a peak of about 175 million in 2002, before falling to 157 million in 2006. Australia's admissions increased more slowly and reached about 93 million in 2002, before falling slightly to 84 million in 2006.

Bài mẫu band 7.0

223 từ. So với bài 6.0: lập luận sâu hơn, từ vựng chính xác và đa dạng hơn, câu phức dùng tự nhiên hơn.

Chart A illustrates the share of films screened in the UK and Australia by country of origin in 2001, while Chart B shows cinema admissions in both countries between 1976 and 2006.

Overall, American films dominated the cinema market in both countries, and domestic films had only a small share, especially in Australia. In terms of admissions, cinema attendance rose considerably in both countries over the thirty years, with the UK consistently recording higher figures.

Còn 2 đoạn của bài 7.0 và bài mẫu band 9.0

Đăng nhập miễn phí để đọc trọn bài, so sánh 3 mức band và viết thử ngay trên đề này.

Đọc tiếp trong app