IELTS Writing Task 1 · Mixed charts

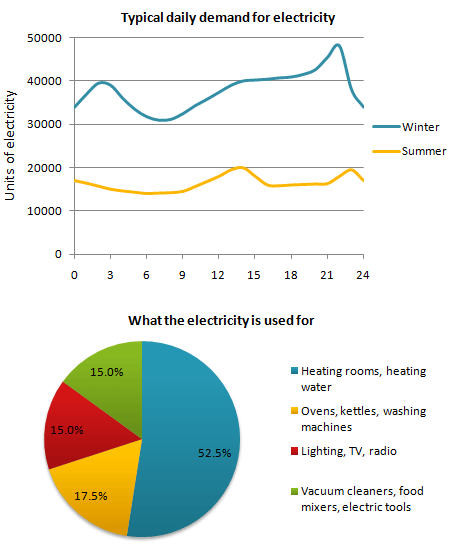
Bài mẫu IELTS Writing Task 1: The graph below shows the demand for electricity in England during typical days in winter and summer.

Biểu đồ kết hợp 20 phút · tối thiểu 150 từ Bài mẫu 6.0 Bài mẫu 7.0 Bài mẫu 9.0 trong app

Đề bài

The graph below shows the demand for electricity in England during typical days in winter and summer. The pie chart shows how electricity is used in an average English home.

Summarise the information by selecting and reporting the main features, and make comparisons where relevant.

IELTS Writing Task 1 Mixed charts: The graph below shows the demand for electricity in England during… Viết ít nhất 150 từ trong khoảng 20 phút.

Dàn ý gợi ý cho dạng Mixed charts

Xem tất cả đề dạng Mixed charts →

Hai biểu đồ khác loại (ví dụ cột + tròn) cùng một chủ đề. Cần mô tả cả hai và nếu có thể, chỉ ra mối liên hệ.

  1. Mở bàiParaphrase đề, nêu rõ có hai biểu đồ và mỗi cái thể hiện gì.
  2. OverviewMột ý chính cho mỗi biểu đồ.
  3. Thân bài 1Biểu đồ thứ nhất với số liệu chính.
  4. Thân bài 2Biểu đồ thứ hai, liên hệ với biểu đồ thứ nhất nếu hợp lý.
  • Chia thời gian và số chữ cân đối cho hai biểu đồ.
  • Dùng từ nối chuyển biểu đồ: Turning to, As for, Meanwhile.
  • Overview phải bao quát cả hai.

Bài mẫu band 6.0

198 từ. Bài đủ ý, bố cục rõ, từ vựng và ngữ pháp ở mức an toàn: đây là mức nhiều bạn cần để đạt mục tiêu 6.0.

The line graph shows the demand for electricity in England during a typical day in winter and summer. The pie chart shows what electricity is used for in an average English home.

Overall, the demand for electricity in winter was much higher than in summer at all times of the day. More than half of the electricity in homes was used for heating rooms and water.

In winter, the demand started at about 34,000 units at midnight and increased to about 40,000 units at around 2 or 3am. Then it fell to the lowest point of about 31,000 units in the morning. After that, the demand rose steadily during the day and reached the highest point of about 48,000 units at around 10pm, before it dropped to 34,000 at midnight.

In summer, the demand was between about 14,000 and 20,000 units all day. It was lowest in the morning and highest at around 2pm and 11pm, at about 20,000 units.

The pie chart shows that 52.5% of electricity was used for heating rooms and water. Ovens, kettles and washing machines used 17.5%, while lighting, TV and radio, and vacuum cleaners, food mixers and electric tools used 15% each.

Bài mẫu band 7.0

205 từ. So với bài 6.0: lập luận sâu hơn, từ vựng chính xác và đa dạng hơn, câu phức dùng tự nhiên hơn.

The line graph illustrates typical daily electricity demand in England in winter and summer, while the pie chart shows how electricity is used in an average English household.

Overall, electricity demand was considerably higher in winter than in summer throughout the day, and demand in both seasons fluctuated, with peaks occurring in the late evening. The pie chart indicates that heating accounted for more than half of household electricity use, which may explain the higher demand in winter.

In winter, demand stood at around 34,000 units at midnight and rose to approximately 40,000 units in the early hours of the morning, before falling to a low of about 31,000 units around 7 to 8am. It then increased steadily throughout the day, reaching a peak of nearly 48,000 units at around 10pm, before dropping sharply.

Còn 2 đoạn của bài 7.0 và bài mẫu band 9.0

Đăng nhập miễn phí để đọc trọn bài, so sánh 3 mức band và viết thử ngay trên đề này.

Đọc tiếp trong app