IELTS Writing Task 1 · Mixed charts

Bài mẫu IELTS Writing Task 1: Biểu đồ kết hợp #161

Biểu đồ kết hợp 20 phút · tối thiểu 150 từ Bài mẫu 6.0 Bài mẫu 7.0 Bài mẫu 9.0 trong app

Đề bài

You should spend about 20 minutes on this task.

IELTS Writing Task 1 Mixed charts: Biểu đồ kết hợp #161 IELTS Writing Task 1 Mixed charts: Biểu đồ kết hợp #161 Viết ít nhất 150 từ trong khoảng 20 phút.

Dàn ý gợi ý cho dạng Mixed charts

Xem tất cả đề dạng Mixed charts →

Hai biểu đồ khác loại (ví dụ cột + tròn) cùng một chủ đề. Cần mô tả cả hai và nếu có thể, chỉ ra mối liên hệ.

  1. Mở bàiParaphrase đề, nêu rõ có hai biểu đồ và mỗi cái thể hiện gì.
  2. OverviewMột ý chính cho mỗi biểu đồ.
  3. Thân bài 1Biểu đồ thứ nhất với số liệu chính.
  4. Thân bài 2Biểu đồ thứ hai, liên hệ với biểu đồ thứ nhất nếu hợp lý.
  • Chia thời gian và số chữ cân đối cho hai biểu đồ.
  • Dùng từ nối chuyển biểu đồ: Turning to, As for, Meanwhile.
  • Overview phải bao quát cả hai.

Bài mẫu band 6.0

189 từ. Bài đủ ý, bố cục rõ, từ vựng và ngữ pháp ở mức an toàn: đây là mức nhiều bạn cần để đạt mục tiêu 6.0.

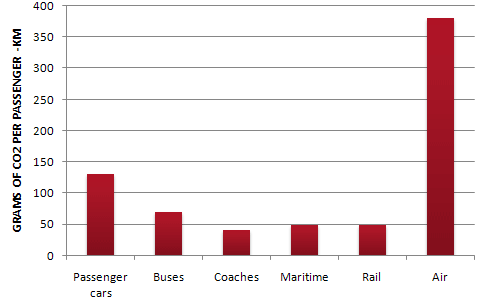
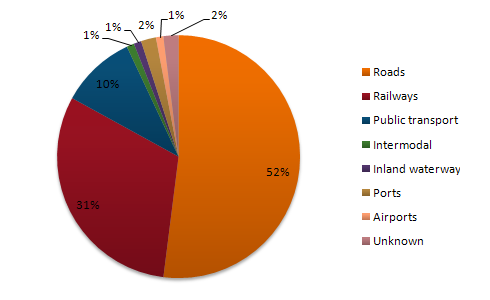
The bar chart shows the amount of carbon dioxide produced by different types of transport, measured in grams per passenger per kilometre. The pie chart shows the percentage share of different types of transport infrastructure.

Overall, air travel produced the most CO2 by far, while coaches, ships and trains produced the least. In the pie chart, roads and railways had the biggest shares.

According to the bar chart, air travel produced about 380 grams of CO2 per passenger-km, which was much higher than any other type of transport. Passenger cars were second with about 130 grams. Buses produced about 70 grams. Maritime transport and rail produced only about 48 grams each, and coaches were the lowest at around 40 grams.

The pie chart shows that roads had the largest share, at 52%, which was more than half. Railways were second with 31%, and public transport was 10%. The other types were very small. Ports had 2% and unknown was also 2%, while intermodal transport, inland waterways and airports had only 1% each. It is interesting that airports had a very small share, but air travel produced the most pollution.

Bài mẫu band 7.0

193 từ. So với bài 6.0: lập luận sâu hơn, từ vựng chính xác và đa dạng hơn, câu phức dùng tự nhiên hơn.

The bar chart compares the carbon dioxide emissions of six modes of transport, measured in grams per passenger-kilometre, while the pie chart shows the percentage share of different types of transport infrastructure.

Overall, air travel was by far the most polluting form of transport, whereas coaches, rail and maritime transport produced the lowest emissions. The pie chart indicates that roads and railways accounted for the vast majority of the total.

Còn 2 đoạn của bài 7.0 và bài mẫu band 9.0

Đăng nhập miễn phí để đọc trọn bài, so sánh 3 mức band và viết thử ngay trên đề này.

Đọc tiếp trong app