
 Viết ít nhất 150 từ trong khoảng 20 phút.
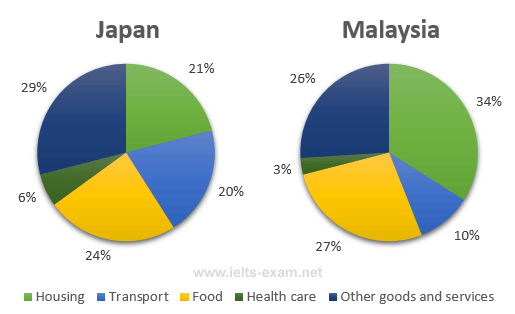
The pie charts show how much households in Japan and Malaysia spent on different things on average in 2010. The categories are housing, transport, food, health care, and other goods and services.
Overall, Japanese households spent the most money on other goods and services, while Malaysian households spent the most on housing. Health care was the smallest expense in both countries.
In Japan, 29% of household money was spent on other goods and services, which was the biggest part. Food was the second with 24%, and housing and transport were quite similar, at 21% and 20%. Only 6% of the money was spent on health care.
In Malaysia, housing was the biggest expense with 34%, which was much higher than in Japan. Food was 27%, a little more than in Japan, and other goods and services was 26%. However, Malaysians spent only 10% on transport, which was half of the figure for Japan. Health care was also very low at 3%, so it was the smallest category in both countries.