
 Viết ít nhất 150 từ trong khoảng 20 phút.
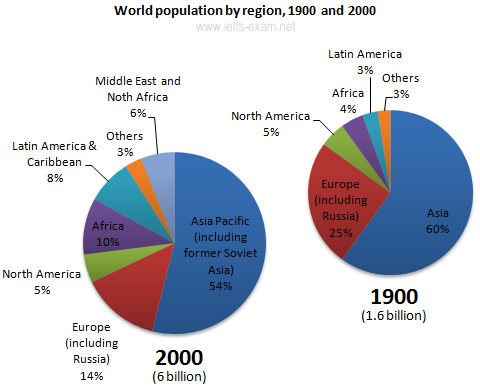
The pie charts show how the world population was divided between different regions in 1900 and 2000.
Overall, the world population increased a lot, from 1.6 billion in 1900 to 6 billion in 2000. Asia had the biggest share of the population in both years, while Europe's share decreased a lot.
In 1900, 60% of the people in the world lived in Asia, which was the biggest percentage. Europe, including Russia, was second with 25%. The other regions had much smaller percentages. North America had 5%, Africa had 4%, and Latin America and other regions had 3% each.
In 2000, the share of Asia Pacific fell slightly to 54%, but it was still the largest region. Europe dropped a lot to only 14%. On the other hand, Africa increased from 4% to 10%, and Latin America and the Caribbean rose from 3% to 8%. North America stayed the same at 5%. The Middle East and North Africa had 6% in 2000, and other regions had 3%, which was the same as in 1900.