IELTS Writing Task 1 · Mixed charts

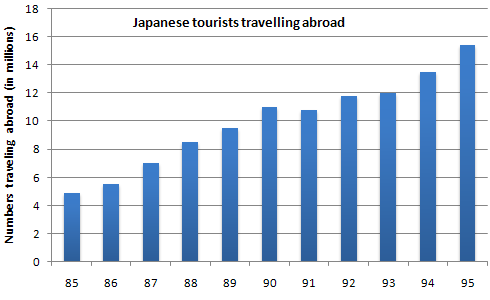
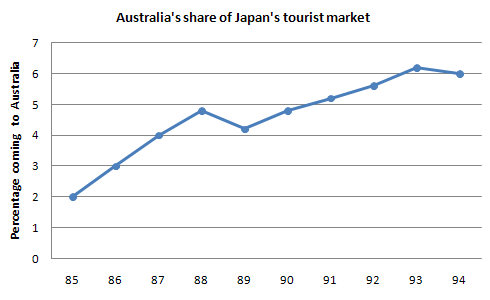
Bài mẫu IELTS Writing Task 1: The charts below show the number of Japanese tourists travelling abroad between 1985 and 1995 and Australias share of the Japanese tourist market.

Biểu đồ kết hợp 20 phút · tối thiểu 150 từ Bài mẫu 6.0 Bài mẫu 7.0 Bài mẫu 9.0 trong app

Đề bài

The charts below show the number of Japanese tourists travelling abroad between 1985 and 1995 and Australias share of the Japanese tourist market.
Write a report for a university lecturer describing the information shown below.

IELTS Writing Task 1 Mixed charts: The charts below show the number of Japanese tourists travelling… IELTS Writing Task 1 Mixed charts: The charts below show the number of Japanese tourists travelling… Viết ít nhất 150 từ trong khoảng 20 phút.

Dàn ý gợi ý cho dạng Mixed charts

Xem tất cả đề dạng Mixed charts →

Hai biểu đồ khác loại (ví dụ cột + tròn) cùng một chủ đề. Cần mô tả cả hai và nếu có thể, chỉ ra mối liên hệ.

  1. Mở bàiParaphrase đề, nêu rõ có hai biểu đồ và mỗi cái thể hiện gì.
  2. OverviewMột ý chính cho mỗi biểu đồ.
  3. Thân bài 1Biểu đồ thứ nhất với số liệu chính.
  4. Thân bài 2Biểu đồ thứ hai, liên hệ với biểu đồ thứ nhất nếu hợp lý.
  • Chia thời gian và số chữ cân đối cho hai biểu đồ.
  • Dùng từ nối chuyển biểu đồ: Turning to, As for, Meanwhile.
  • Overview phải bao quát cả hai.

Bài mẫu band 6.0

179 từ. Bài đủ ý, bố cục rõ, từ vựng và ngữ pháp ở mức an toàn: đây là mức nhiều bạn cần để đạt mục tiêu 6.0.

The bar chart shows the number of Japanese tourists who travelled abroad from 1985 to 1995, and the line graph shows the percentage of these tourists who went to Australia from 1985 to 1994.

Overall, the number of Japanese people travelling abroad increased a lot during the period. Australia's share of the Japanese tourist market also increased, although there were some small falls.

In 1985, about 5 million Japanese tourists travelled abroad. This number increased every year, except for a small fall in 1991, and it reached about 11 million in 1990. By 1995, the number had risen to about 15.4 million, which was more than three times the number in 1985.

In 1985, only 2% of Japanese tourists went to Australia. This percentage increased steadily to about 4.8% in 1988, but then it fell slightly to 4.2% in 1989. After that, it rose again and reached a peak of about 6.2% in 1993, before it dropped a little to 6% in 1994. This means that the number of Japanese visitors to Australia increased a lot during the period.

Bài mẫu band 7.0

185 từ. So với bài 6.0: lập luận sâu hơn, từ vựng chính xác và đa dạng hơn, câu phức dùng tự nhiên hơn.

The bar chart illustrates the number of Japanese tourists travelling abroad between 1985 and 1995, while the line graph shows the percentage of those tourists who visited Australia between 1985 and 1994.

Overall, the number of Japanese people travelling overseas more than tripled over the decade. At the same time, Australia's share of this market also grew significantly, which means that the number of Japanese visitors to Australia increased considerably.

Còn 2 đoạn của bài 7.0 và bài mẫu band 9.0

Đăng nhập miễn phí để đọc trọn bài, so sánh 3 mức band và viết thử ngay trên đề này.

Đọc tiếp trong app