
 Viết ít nhất 150 từ trong khoảng 20 phút.
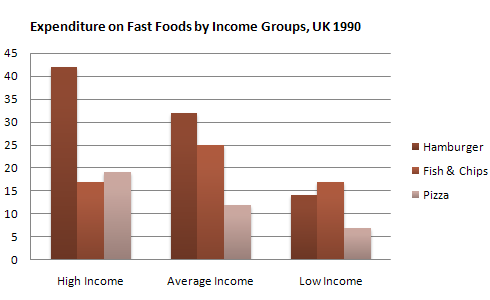
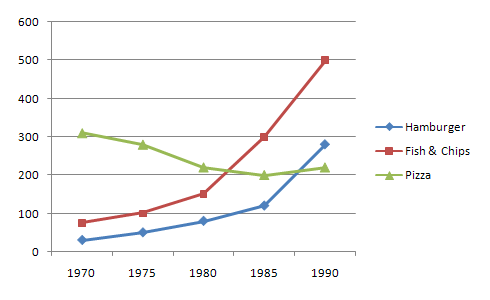
The bar chart shows how much money people in three income groups in the UK spent on three fast foods in 1990, and the line graph shows the changes in the consumption of these fast foods from 1970 to 1990.
Overall, people with high incomes spent the most on fast food, especially hamburgers, while people with low incomes spent the least. The consumption of hamburgers and fish and chips increased a lot, but pizza decreased slightly.
In 1990, high-income people spent about 42 units per week on hamburgers, which was the highest figure. They spent about 17 on fish and chips and 19 on pizza. People with average incomes spent 32 on hamburgers and 25 on fish and chips, but only 12 on pizza. Low-income people spent the least money, with 14 on hamburgers, 17 on fish and chips and only 7 on pizza.
According to the line graph, the consumption of pizza was the highest in 1970, at about 310 units, but it fell to 200 in 1985 and then rose slightly to 220 in 1990. In contrast, fish and chips increased from 75 to 500, and hamburgers rose from 30 to 280 in 1990.