IELTS Writing Task 1 · Pie chart

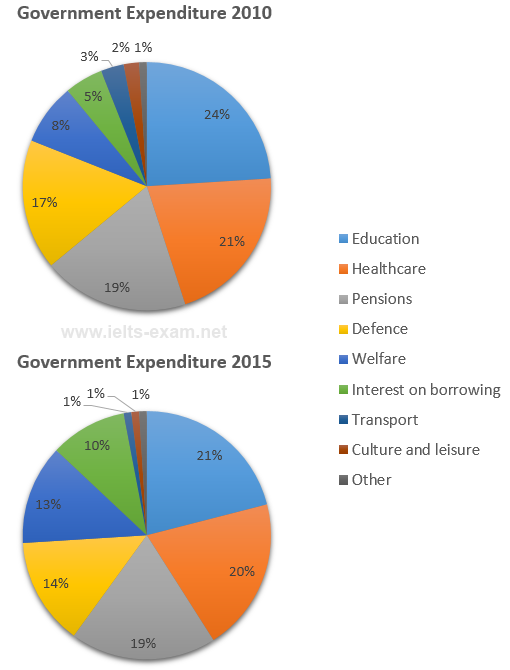
Bài mẫu IELTS Writing Task 1: The charts below show local government expenditure in 2010 and 2015.

Biểu đồ tròn 20 phút · tối thiểu 150 từ Bài mẫu 6.0 Bài mẫu 7.0 Bài mẫu 9.0 trong app

Đề bài

The charts below show local government expenditure in 2010 and 2015.

Summarise the information by selecting and reporting the main features, and make comparisons where relevant.

IELTS Writing Task 1 Pie chart: The charts below show local government expenditure in 2010 and 2015. Viết ít nhất 150 từ trong khoảng 20 phút.

Dàn ý gợi ý cho dạng Pie chart

Xem tất cả đề dạng Pie chart →

Biểu đồ tròn thể hiện tỷ lệ các phần trong một tổng. Thường có 2–3 biểu đồ để so sánh giữa các năm hoặc các nhóm.

  1. Mở bàiParaphrase đề: tỷ lệ của cái gì, ở nhóm/năm nào.
  2. OverviewPhần chiếm tỷ trọng lớn nhất và thay đổi lớn nhất giữa các biểu đồ.
  3. Thân bài 1Các phần lớn, so sánh giữa các biểu đồ.
  4. Thân bài 2Các phần nhỏ hoặc thay đổi đáng chú ý.
  • Đa dạng cách nói tỷ lệ: a quarter, just under half, the vast majority.
  • Dùng account for, make up, constitute thay cho is.
  • Không cộng dồn hay suy diễn số liệu không có trên biểu đồ.

Bài mẫu band 6.0

162 từ. Bài đủ ý, bố cục rõ, từ vựng và ngữ pháp ở mức an toàn: đây là mức nhiều bạn cần để đạt mục tiêu 6.0.

The pie charts show how local government spent its money on different areas in 2010 and 2015.

Overall, education, healthcare and pensions were the three biggest areas of spending in both years. However, the spending on welfare and interest on borrowing increased a lot, while spending on most other areas decreased.

In 2010, education had the largest share of the budget at 24%, followed by healthcare at 21% and pensions at 19%. Defence was 17%, and welfare was 8%. Interest on borrowing was 5%, while transport, culture and leisure, and other areas had very small percentages, at 3%, 2% and 1%.

In 2015, the percentage spent on education fell to 21%, and healthcare dropped slightly to 20%. Pensions stayed the same at 19%. Defence also decreased to 14%. On the other hand, welfare increased to 13%, and the interest on borrowing doubled from 5% to 10%. Transport and culture and leisure fell to only 1% each, and other spending stayed at 1%.

Bài mẫu band 7.0

167 từ. So với bài 6.0: lập luận sâu hơn, từ vựng chính xác và đa dạng hơn, câu phức dùng tự nhiên hơn.

The pie charts compare the proportions of local government expenditure allocated to different areas in 2010 and 2015.

Overall, education, healthcare and pensions accounted for the largest shares of spending in both years. The most significant changes were the increases in spending on welfare and interest on borrowing, which came at the expense of most other categories.

Còn 2 đoạn của bài 7.0 và bài mẫu band 9.0

Đăng nhập miễn phí để đọc trọn bài, so sánh 3 mức band và viết thử ngay trên đề này.

Đọc tiếp trong app