
 Viết ít nhất 150 từ trong khoảng 20 phút.
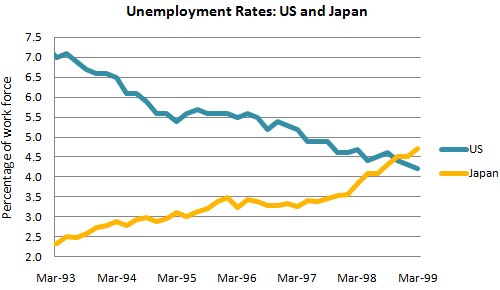
The line graph shows the unemployment rates in the US and Japan from March 1993 to March 1999.
Overall, the unemployment rate in the US decreased during the period, while the rate in Japan increased. The US had a higher rate than Japan for most of the period, but Japan's rate became higher at the end.
In March 1993, the unemployment rate in the US was about 7% of the work force. It went up slightly to about 7.1%, and then it fell steadily to about 5.5% in 1995. After that, the rate stayed between about 5.3% and 5.7% until early 1997. Then it continued to fall and reached about 4.2% in March 1999.
In contrast, the unemployment rate in Japan was only about 2.3% in March 1993. It increased slowly to about 3% in 1994 and around 3.4% in 1996. In 1998, it rose more quickly and reached about 4.1%. At the end of 1998, the rate in Japan became higher than the rate in the US, and it reached about 4.7% in March 1999.