IELTS Writing Task 1 · Table

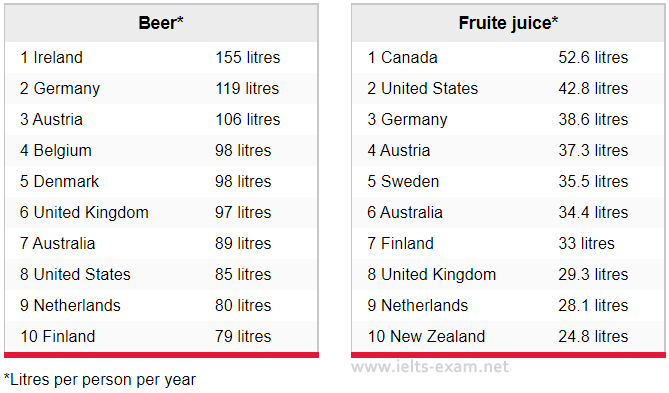
Bài mẫu IELTS Writing Task 1: The tables below give information about the amount of beer and fruit juice consumed per person per year in different countries.

Bảng số liệu 20 phút · tối thiểu 150 từ Bài mẫu 6.0 Bài mẫu 7.0 Bài mẫu 9.0 trong app

Đề bài

The tables below give information about the amount of beer and fruit juice consumed per person per year in different countries.

Summarise the information by selecting and reporting the main features, and make comparisons where relevant.

IELTS Writing Task 1 Table: The tables below give information about the amount of beer and fruit… Viết ít nhất 150 từ trong khoảng 20 phút.

Dàn ý gợi ý cho dạng Table

Xem tất cả đề dạng Table →

Bảng có nhiều số liệu nhất trong các dạng Task 1. Bí quyết là chọn lọc: tìm giá trị cao nhất, thấp nhất, chênh lệch lớn rồi nhóm lại.

  1. Mở bàiParaphrase đề, nêu các hạng mục của bảng.
  2. OverviewHàng/cột nổi bật nhất, xu hướng chung nếu có thời gian.
  3. Thân bài 1Nhóm các hàng có điểm chung, so sánh bằng số liệu.
  4. Thân bài 2Nhóm còn lại, ngoại lệ đáng chú ý.
  • Không mô tả từng ô, chỉ chọn 6–8 số liệu quan trọng.
  • Dùng respectively để gộp hai số liệu trong một câu.
  • So sánh theo hàng hoặc theo cột, chọn cách làm nổi bật khác biệt.

Bài mẫu band 6.0

184 từ. Bài đủ ý, bố cục rõ, từ vựng và ngữ pháp ở mức an toàn: đây là mức nhiều bạn cần để đạt mục tiêu 6.0.

The two tables show the top ten countries for the consumption of beer and fruit juice per person per year. The figures are in litres.

Overall, people drank much more beer than fruit juice. Ireland had the highest beer consumption, while Canada had the highest fruit juice consumption. Some countries were in both tables.

In the beer table, Ireland was the first with 155 litres per person, which was much higher than the other countries. Germany was the second with 119 litres, and Austria was the third with 106 litres. Belgium and Denmark both had 98 litres, and the United Kingdom had 97 litres. The last four countries were Australia, the United States, the Netherlands and Finland, with between 79 and 89 litres.

In the fruit juice table, Canada was the top country with 52.6 litres, followed by the United States with 42.8 litres. Germany had 38.6 litres and Austria had 37.3 litres. The other countries had between 24.8 and 35.5 litres, and New Zealand had the lowest. Germany, Austria, Australia, the United States, the UK, the Netherlands and Finland were in both tables.

Bài mẫu band 7.0

180 từ. So với bài 6.0: lập luận sâu hơn, từ vựng chính xác và đa dạng hơn, câu phức dùng tự nhiên hơn.

The tables rank the ten countries with the highest annual per capita consumption of beer and fruit juice.

Overall, beer consumption was significantly higher than fruit juice consumption in all the countries listed. Ireland was the leading beer-drinking nation by a considerable margin, while Canada topped the fruit juice table. Several countries appeared in both rankings.

Còn 2 đoạn của bài 7.0 và bài mẫu band 9.0

Đăng nhập miễn phí để đọc trọn bài, so sánh 3 mức band và viết thử ngay trên đề này.

Đọc tiếp trong app