IELTS Writing Task 1 · Table

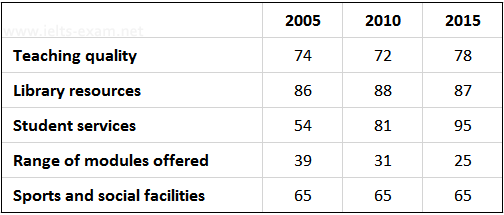
Bài mẫu IELTS Writing Task 1: The table below shows the results of surveys in 2005, 2010 and 2015 about McGill University.

Bảng số liệu 20 phút · tối thiểu 150 từ Bài mẫu 6.0 Bài mẫu 7.0 Bài mẫu 9.0 trong app

Đề bài

The table below shows the results of surveys in 2005, 2010 and 2015 about McGill University.

Summarise the information by selecting and reporting the main features, and make comparisons where relevant.

IELTS Writing Task 1 Table: The table below shows the results of surveys in 2005, 2010 and 2015… Viết ít nhất 150 từ trong khoảng 20 phút.

Dàn ý gợi ý cho dạng Table

Xem tất cả đề dạng Table →

Bảng có nhiều số liệu nhất trong các dạng Task 1. Bí quyết là chọn lọc: tìm giá trị cao nhất, thấp nhất, chênh lệch lớn rồi nhóm lại.

  1. Mở bàiParaphrase đề, nêu các hạng mục của bảng.
  2. OverviewHàng/cột nổi bật nhất, xu hướng chung nếu có thời gian.
  3. Thân bài 1Nhóm các hàng có điểm chung, so sánh bằng số liệu.
  4. Thân bài 2Nhóm còn lại, ngoại lệ đáng chú ý.
  • Không mô tả từng ô, chỉ chọn 6–8 số liệu quan trọng.
  • Dùng respectively để gộp hai số liệu trong một câu.
  • So sánh theo hàng hoặc theo cột, chọn cách làm nổi bật khác biệt.

Bài mẫu band 6.0

179 từ. Bài đủ ý, bố cục rõ, từ vựng và ngữ pháp ở mức an toàn: đây là mức nhiều bạn cần để đạt mục tiêu 6.0.

The table shows the results of surveys about five aspects of McGill University in 2005, 2010 and 2015. The figures show the percentage of students who were satisfied with each aspect.

Overall, students were most satisfied with library resources in most years, and student services improved the most. However, the range of modules offered became less popular over the period.

In 2005, library resources had the highest satisfaction at 86%, and it stayed at a similar level, at 88% in 2010 and 87% in 2015. Teaching quality was 74% in 2005, dropped slightly to 72% in 2010 and then increased to 78% in 2015. Sports and social facilities did not change at all, with 65% in all three years.

Student services had the biggest change. Only 54% of students were satisfied in 2005, but this rose to 81% in 2010 and 95% in 2015, which was the highest figure in the table. In contrast, the range of modules offered had the lowest satisfaction, and it fell from 39% in 2005 to 31% in 2010 and only 25% in 2015.

Bài mẫu band 7.0

176 từ. So với bài 6.0: lập luận sâu hơn, từ vựng chính xác và đa dạng hơn, câu phức dùng tự nhiên hơn.

The table presents the findings of surveys conducted in 2005, 2010 and 2015 on students' satisfaction with five aspects of McGill University.

Overall, satisfaction with student services improved dramatically over the decade, whereas satisfaction with the range of modules offered declined. The ratings for teaching quality, library resources and sports and social facilities remained relatively stable.

Còn 2 đoạn của bài 7.0 và bài mẫu band 9.0

Đăng nhập miễn phí để đọc trọn bài, so sánh 3 mức band và viết thử ngay trên đề này.

Đọc tiếp trong app