
 Viết ít nhất 150 từ trong khoảng 20 phút.
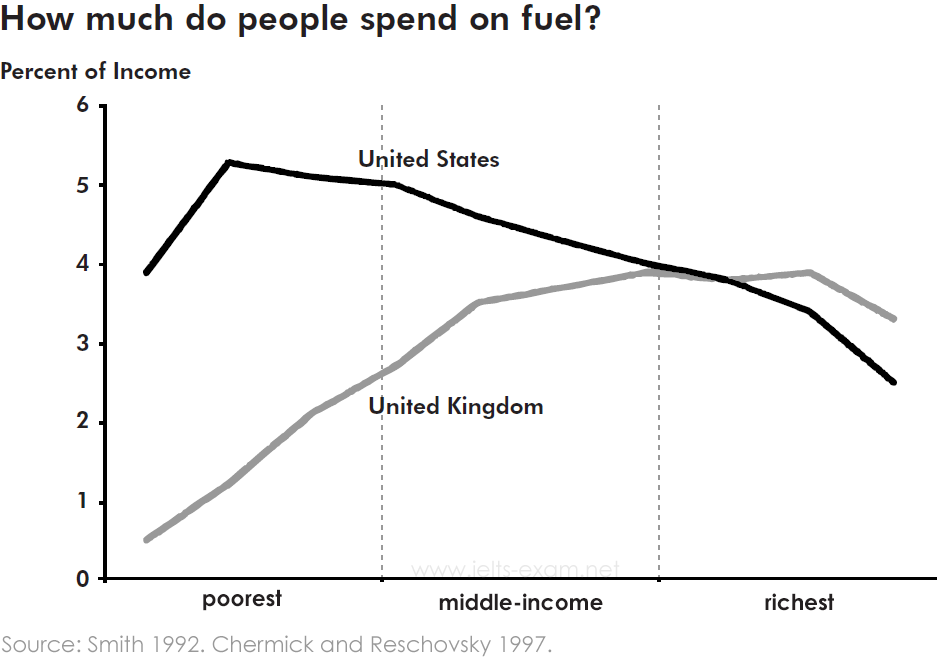
The line graph shows the percentage of income that people in the United States and the United Kingdom spend on fuel, divided into three income groups: the poorest, middle-income and the richest.
Overall, Americans spent a higher percentage of their income on fuel than British people in most income groups. In the US, the percentage decreased as people became richer, while in the UK it increased for most groups.
In the United States, the poorest people spent about 3.9% of their income on fuel at the lowest level, and this went up to a peak of about 5.3%. After that, the percentage decreased slowly through the middle-income group to around 4%. The richest Americans spent the lowest percentage, falling to only 2.5%.
In contrast, the poorest people in the UK spent only about 0.5% of their income on fuel. This figure rose steadily through the poorest and middle-income groups and reached about 3.9%. It stayed at this level for some of the richest group, which was higher than the US, before it dropped to about 3.3% at the end.