IELTS Writing Task 1 · Line graph

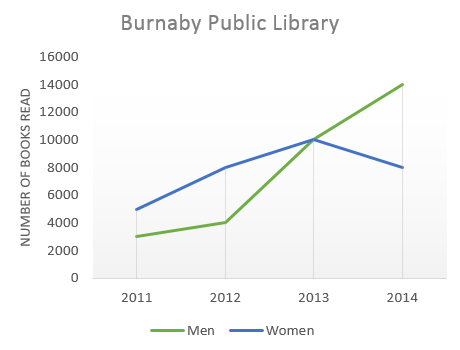
Bài mẫu IELTS Writing Task 1: The graph below shows the number of books read by men and women at Burnaby Public Library from 2011 to 2014.

Biểu đồ đường 20 phút · tối thiểu 150 từ Bài mẫu 6.0 Bài mẫu 7.0 Bài mẫu 9.0 trong app

Đề bài

The graph below shows the number of books read by men and women at Burnaby Public Library from 2011 to 2014.

Summarise the information by selecting and reporting the main features,
and make comparisons where relevant.

IELTS Writing Task 1 Line graph: The graph below shows the number of books read by men and women at… Viết ít nhất 150 từ trong khoảng 20 phút.

Dàn ý gợi ý cho dạng Line graph

Xem tất cả đề dạng Line graph →

Biểu đồ đường thể hiện sự thay đổi theo thời gian. Giám khảo chấm cao khi bạn mô tả được xu hướng (tăng, giảm, dao động, ổn định) và so sánh các đường với nhau.

  1. Mở bàiParaphrase đề, nêu khoảng thời gian.
  2. OverviewXu hướng chung của từng đường + đường nào cao nhất/thay đổi nhiều nhất.
  3. Thân bài 1Giai đoạn đầu hoặc nhóm đường tăng: điểm bắt đầu, đỉnh, mốc thay đổi.
  4. Thân bài 2Giai đoạn sau hoặc nhóm đường giảm, điểm giao nhau, điểm kết thúc.
  • Từ vựng xu hướng: rise steadily, peak at, plummet, level off, fluctuate.
  • Dùng thì phù hợp: quá khứ cho số liệu đã qua, will/is predicted to cho dự báo.
  • Nêu các điểm giao nhau (overtake, surpass).

Bài mẫu band 6.0

169 từ. Bài đủ ý, bố cục rõ, từ vựng và ngữ pháp ở mức an toàn: đây là mức nhiều bạn cần để đạt mục tiêu 6.0.

The line graph shows the number of books that men and women read at Burnaby Public Library between 2011 and 2014.

Overall, the number of books read by men increased a lot during the period. Women read more books than men at the beginning, but men read more books at the end of the period.

In 2011, women read about 5,000 books, while men read only 3,000 books. In 2012, the number of books read by women increased to 8,000, but men only increased slightly to 4,000. This means that women read twice as many books as men in that year.

In 2013, both men and women read the same number of books, which was 10,000. After that, the number of books read by men continued to rise sharply and reached 14,000 in 2014, which was the highest number in the graph. In contrast, the number of books read by women decreased to 8,000 in 2014. So, in the last year, men read 6,000 more books than women did.

Bài mẫu band 7.0

175 từ. So với bài 6.0: lập luận sâu hơn, từ vựng chính xác và đa dạng hơn, câu phức dùng tự nhiên hơn.

The line graph compares the number of books read by men and women at Burnaby Public Library over the four-year period from 2011 to 2014.

Overall, the number of books read by men rose dramatically throughout the period, whereas the figure for women increased initially but then declined. As a result, although women read more books than men in the first two years, men had overtaken them by 2014.

Còn 2 đoạn của bài 7.0 và bài mẫu band 9.0

Đăng nhập miễn phí để đọc trọn bài, so sánh 3 mức band và viết thử ngay trên đề này.

Đọc tiếp trong app