
 Viết ít nhất 150 từ trong khoảng 20 phút.
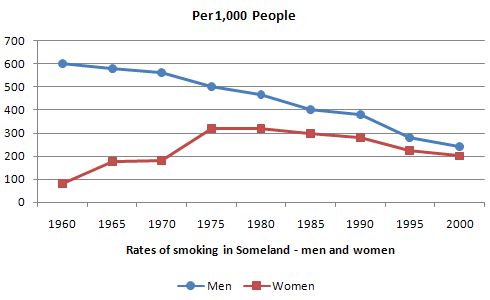
The line graph shows the rates of smoking among men and women in Someland from 1960 to 2000. The figures are the number of smokers per 1,000 people.
Overall, the smoking rate for men decreased steadily during the whole period. The rate for women increased until 1975 and then it decreased. Men smoked more than women in all years.
In 1960, about 600 men per 1,000 smoked, which was the highest figure in the graph. This number fell slowly to 500 in 1975 and 400 in 1985. After that, it continued to decrease and reached about 240 in 2000, which was less than half of the 1960 figure.
In contrast, only 80 women per 1,000 smoked in 1960. This figure increased to about 175 in 1965 and stayed almost the same in 1970. Then it rose sharply to 320 in 1975 and stayed at this level in 1980. After 1980, the rate for women started to fall slowly, and it reached about 200 in 2000. In 2000, the difference between men and women was much smaller than in 1960.