
 Viết ít nhất 150 từ trong khoảng 20 phút.
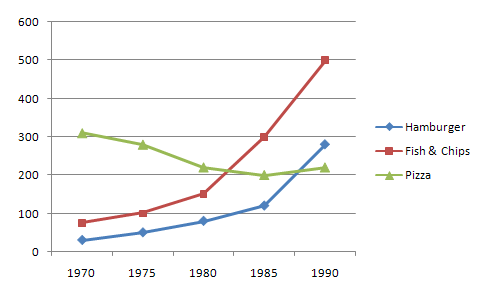
The line graph shows the changes in the consumption of three types of fast food, hamburgers, fish and chips, and pizza, from 1970 to 1990.
Overall, the consumption of hamburgers and fish and chips increased a lot during the period. In contrast, the consumption of pizza decreased slightly. Pizza was the most popular in 1970, but fish and chips was the most popular in 1990.
In 1970, pizza had the highest figure at about 310 units. However, it fell to 280 in 1975 and 220 in 1980. It continued to decrease to 200 in 1985, and then it went up a little to 220 in 1990.
Fish and chips started at only about 75 units in 1970. It increased slowly to 100 in 1975 and 150 in 1980. After that, it rose quickly to 300 in 1985 and reached 500 in 1990, which was the highest figure in the graph.
Hamburgers had the lowest consumption at the beginning, at only 30 units. It increased slowly to 80 in 1980 and 120 in 1985. Then it rose sharply to 280 in 1990, which was higher than pizza.