
 Viết ít nhất 150 từ trong khoảng 20 phút.
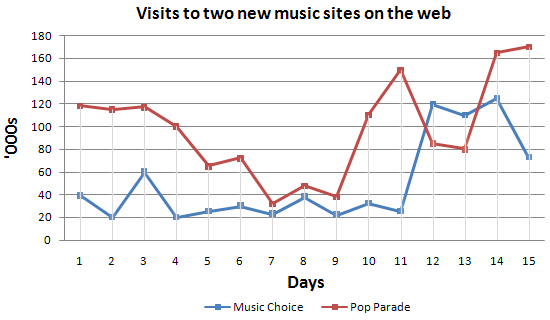
The line graph shows the number of visits to two new music websites, Music Choice and Pop Parade, over a period of 15 days. The figures are in thousands.
Overall, Pop Parade had more visitors than Music Choice on most days. The numbers of visitors to both sites changed a lot, and both sites had more visitors at the end of the period than at the beginning.
On the first day, Pop Parade had about 118,000 visits, while Music Choice had only 40,000. The visits to Pop Parade stayed stable for three days and then fell to about 32,000 on day 7. After that, the number increased sharply to 150,000 on day 11. It dropped to around 80,000 on days 12 and 13, but then it rose again to the highest point of 170,000 on day 15.
Music Choice had a low number of visits for the first 11 days, between 20,000 and 60,000. On day 12, the number rose suddenly to 120,000, which was higher than Pop Parade. It reached a peak of 125,000 on day 14, but then fell to about 72,000 on the last day.