IELTS Writing Task 1 · Table

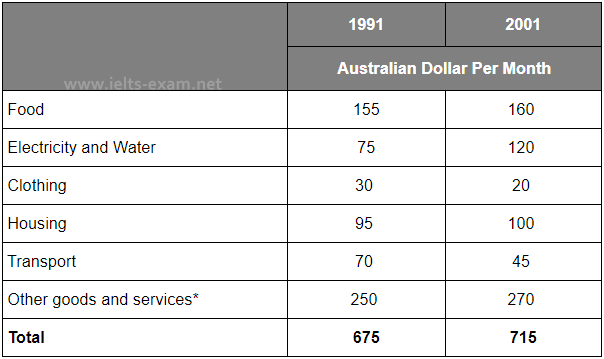
Bài mẫu IELTS Writing Task 1: The table below shows the monthly expenditure of an average Australian family in 1991 and 2001.

Bảng số liệu 20 phút · tối thiểu 150 từ Bài mẫu 6.0 Bài mẫu 7.0 Bài mẫu 9.0 trong app

Đề bài

The table below shows the monthly expenditure of an average Australian family in 1991 and 2001.

Summarise the information by selecting and reporting the main features, and make comparisons where relevant.

IELTS Writing Task 1 Table: The table below shows the monthly expenditure of an average… Viết ít nhất 150 từ trong khoảng 20 phút.

Dàn ý gợi ý cho dạng Table

Xem tất cả đề dạng Table →

Bảng có nhiều số liệu nhất trong các dạng Task 1. Bí quyết là chọn lọc: tìm giá trị cao nhất, thấp nhất, chênh lệch lớn rồi nhóm lại.

  1. Mở bàiParaphrase đề, nêu các hạng mục của bảng.
  2. OverviewHàng/cột nổi bật nhất, xu hướng chung nếu có thời gian.
  3. Thân bài 1Nhóm các hàng có điểm chung, so sánh bằng số liệu.
  4. Thân bài 2Nhóm còn lại, ngoại lệ đáng chú ý.
  • Không mô tả từng ô, chỉ chọn 6–8 số liệu quan trọng.
  • Dùng respectively để gộp hai số liệu trong một câu.
  • So sánh theo hàng hoặc theo cột, chọn cách làm nổi bật khác biệt.

Bài mẫu band 6.0

173 từ. Bài đủ ý, bố cục rõ, từ vựng và ngữ pháp ở mức an toàn: đây là mức nhiều bạn cần để đạt mục tiêu 6.0.

The table shows how much money an average Australian family spent each month on different things in 1991 and 2001. The figures are in Australian dollars.

Overall, the total monthly spending increased from 675 dollars in 1991 to 715 dollars in 2001. Other goods and services was the biggest expense in both years, while clothing was the smallest.

In 1991, families spent 250 dollars per month on other goods and services, which was the most. Food was the second biggest expense at 155 dollars, followed by housing at 95 dollars. They spent 75 dollars on electricity and water and 70 dollars on transport. Clothing was only 30 dollars.

In 2001, the spending on other goods and services rose to 270 dollars. Electricity and water had the biggest increase, from 75 to 120 dollars. Food and housing also increased a little, to 160 and 100 dollars. However, the money spent on transport fell from 70 to 45 dollars, and clothing also decreased from 30 to 20 dollars, so it was still the smallest category.

Bài mẫu band 7.0

176 từ. So với bài 6.0: lập luận sâu hơn, từ vựng chính xác và đa dạng hơn, câu phức dùng tự nhiên hơn.

The table compares the average monthly expenditure of an Australian family on six categories in 1991 and 2001.

Overall, total monthly spending rose modestly over the decade, from 675 to 715 Australian dollars. Other goods and services remained the largest area of expenditure, while the most notable changes were a sharp increase in spending on electricity and water and decreases in spending on transport and clothing.

Còn 2 đoạn của bài 7.0 và bài mẫu band 9.0

Đăng nhập miễn phí để đọc trọn bài, so sánh 3 mức band và viết thử ngay trên đề này.

Đọc tiếp trong app