
 Viết ít nhất 150 từ trong khoảng 20 phút.
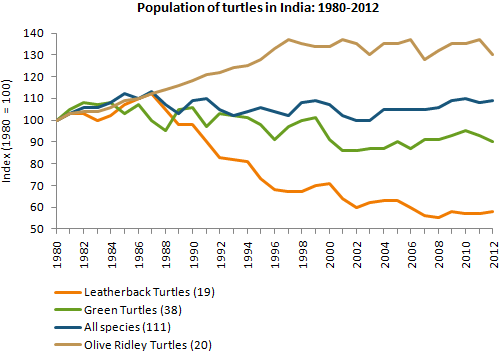
The line graph shows the changes in the population of different types of turtles in India from 1980 to 2012. The figures are shown as an index, where the population in 1980 is 100.
Overall, the population of Olive Ridley turtles increased the most, while Leatherback turtles decreased the most. The population of all species together increased slightly over the period.
Olive Ridley turtles increased steadily from 100 in 1980 to about 137 in 1997. After that, the number went up and down between about 128 and 137, and it was 130 in 2012. The index for all species changed only a little. It was between about 100 and 113 during the whole period, and it was around 109 in 2012.
On the other hand, Leatherback turtles rose to about 110 in 1987, but after that they fell sharply to around 67 in 1997. They continued to decrease and reached about 58 in 2012, which was the lowest figure. Green turtles went up and down a lot, and they fell to about 86 in 2001, before they increased slightly to 90 in 2012.