
 Viết ít nhất 150 từ trong khoảng 20 phút.
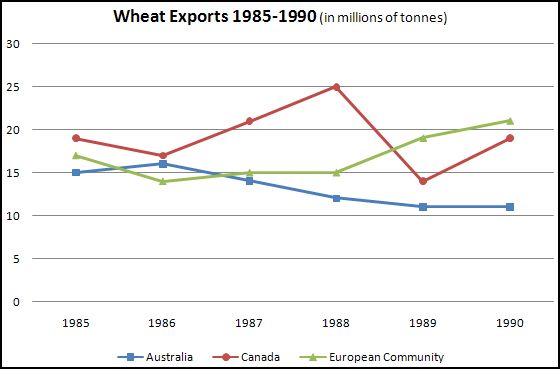
The line graph shows the amount of wheat exported by Australia, Canada and the European Community from 1985 to 1990. The figures are in millions of tonnes.
Overall, the wheat exports of the European Community increased, while Australia's exports decreased. Canada's exports changed a lot during the period.
In 1985, Canada exported about 19 million tonnes of wheat, which was the highest. The European Community exported 17 million tonnes and Australia exported 15 million tonnes.
Canada's exports fell slightly to 17 million tonnes in 1986, but then they increased quickly and reached a peak of 25 million tonnes in 1988. After that, they dropped sharply to 14 million tonnes in 1989, before they rose again to 19 million tonnes in 1990.
The European Community's exports fell to 14 million tonnes in 1986 and stayed at 15 million tonnes in 1987 and 1988. Then they increased to 21 million tonnes in 1990, which was the highest in that year. Australia's exports went up slightly to 16 million tonnes in 1986, but then they decreased steadily to 11 million tonnes in 1989 and 1990.