
 Viết ít nhất 150 từ trong khoảng 20 phút.
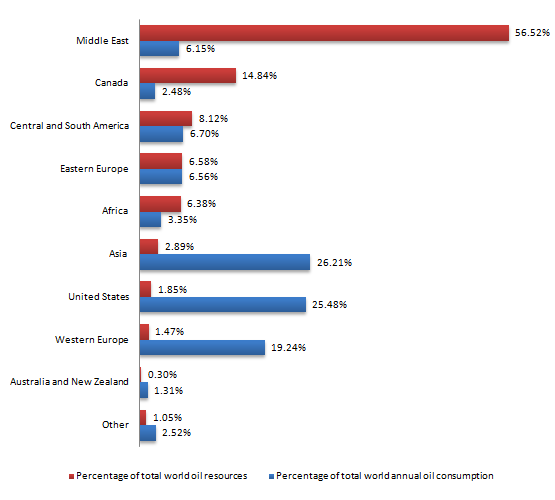
The bar chart shows the percentage of the world's oil resources in different areas, and the percentage of the world's oil that each area uses every year.
Overall, the Middle East had the most oil resources by far, but it did not use much oil. In contrast, Asia, the United States and Western Europe used a lot of oil, but they had very small oil resources.
The Middle East had 56.52% of the world's oil resources, which was more than half. However, it only used 6.15% of the world's oil. Canada had the second largest resources at 14.84%, but it used only 2.48%. Central and South America, Eastern Europe and Africa had between 6% and 8% of the resources, and Eastern Europe used almost the same amount as it had, at 6.56%.
On the other hand, Asia used the most oil, at 26.21%, but it had only 2.89% of the resources. The United States used 25.48% and had 1.85%. Western Europe also used 19.24% of the world's oil, but it had only 1.47% of the resources. Australia and New Zealand had the smallest resources at 0.3% and used 1.31%.