IELTS Writing Task 1 · Bar chart

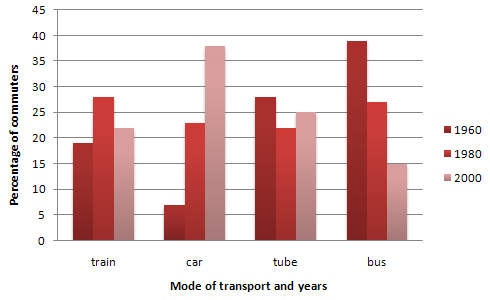
Bài mẫu IELTS Writing Task 1: The graph below shows the different modes of transport used to travel to and from work in one European city in 1960, 1980 and 2000.

Biểu đồ cột 20 phút · tối thiểu 150 từ Bài mẫu 6.0 Bài mẫu 7.0 Bài mẫu 9.0 trong app

Đề bài

The graph below shows the different modes of transport used to travel to and from work in one European city in 1960, 1980 and 2000.

Write a report for a university lecturer describing the information below.

IELTS Writing Task 1 Bar chart: The graph below shows the different modes of transport used to travel… Viết ít nhất 150 từ trong khoảng 20 phút.

Dàn ý gợi ý cho dạng Bar chart

Xem tất cả đề dạng Bar chart →

Biểu đồ cột so sánh số liệu giữa các nhóm, đôi khi qua nhiều mốc thời gian. Điểm mấu chốt là nhóm số liệu để so sánh, không mô tả từng cột.

  1. Mở bàiParaphrase đề: biểu đồ cho thấy gì, ở đâu, khi nào. Không chép nguyên câu đề.
  2. Overview2 câu nêu đặc điểm nổi bật nhất: nhóm cao nhất/thấp nhất, xu hướng chung. Không đưa số liệu chi tiết.
  3. Thân bài 1Nhóm các cột có điểm chung (cùng tăng, cùng cao…), so sánh kèm số liệu cụ thể.
  4. Thân bài 2Nhóm còn lại hoặc các điểm ngoại lệ, tiếp tục so sánh bằng số liệu.
  • Dùng cấu trúc so sánh: higher than, twice as many as, the largest proportion of.
  • Mỗi đoạn thân bài nên có 3–4 số liệu, đừng liệt kê hết.
  • Chú ý đơn vị: %, million, tonnes.

Bài mẫu band 6.0

189 từ. Bài đủ ý, bố cục rõ, từ vựng và ngữ pháp ở mức an toàn: đây là mức nhiều bạn cần để đạt mục tiêu 6.0.

The bar chart shows the percentage of commuters in a European city who used four types of transport, train, car, tube and bus, to travel to and from work in 1960, 1980 and 2000.

Overall, the car became much more popular during the period, while the bus became much less popular. The use of the train and the tube changed only a little.

In 1960, the bus was the most popular way to travel to work, with about 39% of commuters. The tube was second with 28%, and the train had 19%. Only 7% of people used a car.

In 1980, the percentage of people who used a car increased a lot to 23%, and the train also increased to 28%, so it became the most popular. However, the bus fell to 27% and the tube dropped to 22%.

In 2000, the car was the most popular type of transport, with 38% of commuters, which was more than five times the figure in 1960. The tube went up slightly to 25%, but the train fell to 22%. The bus continued to decrease and only 15% of people used it.

Bài mẫu band 7.0

187 từ. So với bài 6.0: lập luận sâu hơn, từ vựng chính xác và đa dạng hơn, câu phức dùng tự nhiên hơn.

The bar chart compares the proportion of commuters using four modes of transport to travel to and from work in a European city in 1960, 1980 and 2000.

Overall, there was a significant shift from buses to cars over the forty-year period. While the bus was the most common means of commuting in 1960, the car had become the most popular by 2000. Train and tube use, by contrast, fluctuated within a relatively narrow range.

Còn 2 đoạn của bài 7.0 và bài mẫu band 9.0

Đăng nhập miễn phí để đọc trọn bài, so sánh 3 mức band và viết thử ngay trên đề này.

Đọc tiếp trong app