
 Viết ít nhất 150 từ trong khoảng 20 phút.
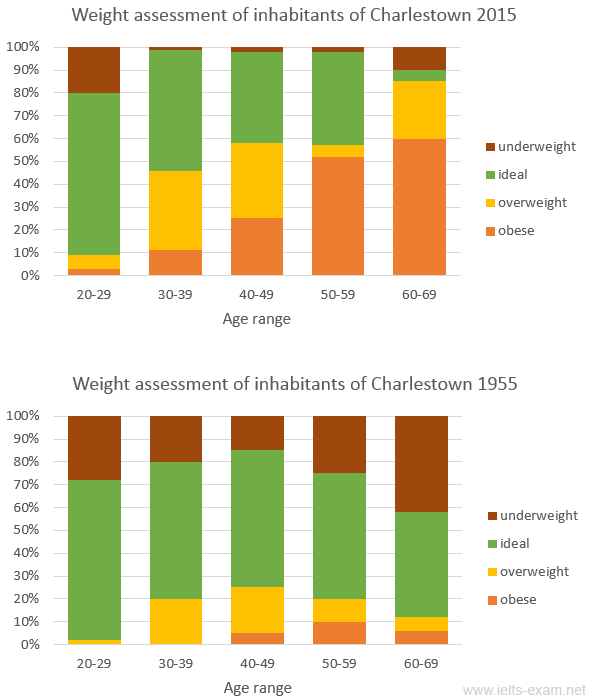
The bar charts show the weight assessment of people in different age groups living in Charlestown in 1955 and 2015. People were divided into four groups: underweight, ideal, overweight and obese.
Overall, people in 2015 were much heavier than people in 1955. In 1955, most people in all age groups had an ideal weight, but in 2015 obesity was very common, especially among older people.
In 1955, about 70% of people aged 20 to 29 had an ideal weight, and around 60% of people aged 30 to 49 were also ideal. Underweight people were quite common, especially in the 60 to 69 age group, at about 42%. Obesity was very rare and it was never more than 10% in any age group.
In 2015, the situation was very different. The percentage of obese people increased with age, from about 3% for people in their twenties to 60% for people aged 60 to 69. Only 5% of the oldest group had an ideal weight. However, the youngest group did not change much, with about 70% still having an ideal weight.