
 Viết ít nhất 150 từ trong khoảng 20 phút.
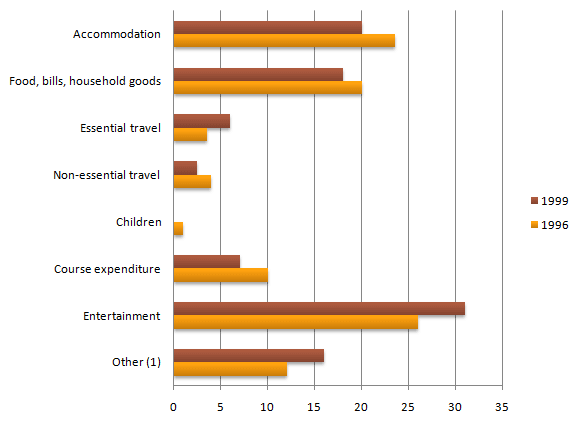
The bar chart shows how students in the United Kingdom spent their money in 1996 and 1999. The figures show the percentage of total spending on each category.
Overall, entertainment was the biggest area of spending in both years, followed by accommodation and food, bills and household goods. Students spent very little on children and travel.
In 1996, entertainment made up about 26% of student spending, and accommodation was about 23.5%. Food, bills and household goods were 20%, and course expenditure was 10%. Other spending was 12%. Essential travel and non-essential travel were only about 3.5% and 4%, and children were just 1%.
In 1999, the percentage spent on entertainment increased to about 31%. Other spending also rose to 16%, and essential travel went up to 6%. However, the percentage spent on accommodation fell to 20%, and food, bills and household goods decreased to 18%. Course expenditure dropped from 10% to 7%, and non-essential travel fell to 2.5%. In 1999, students did not spend any money on children.