
 Viết ít nhất 150 từ trong khoảng 20 phút.
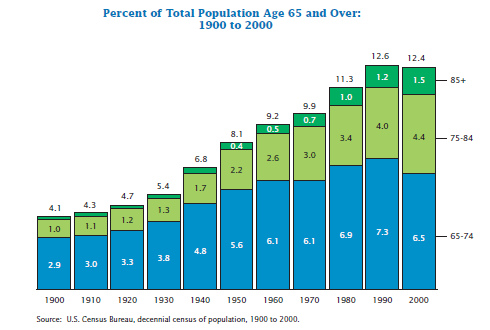
The bar chart shows the percentage of the US population who were aged 65 and over from 1900 to 2000. The chart also divides these people into three age groups: 65 to 74, 75 to 84, and 85 and over.
Overall, the percentage of older people in the US increased a lot during the century. The 65 to 74 group was always the biggest group, but the older groups grew faster.
In 1900, only 4.1% of the population was aged 65 and over. Most of them were aged 65 to 74, at 2.9%, and 1.0% were aged 75 to 84. The percentage increased slowly to 5.4% in 1930, and then it rose more quickly to 8.1% in 1950 and 9.9% in 1970.
The total reached the highest point of 12.6% in 1990, before it fell slightly to 12.4% in 2000. The 65 to 74 group rose to 7.3% in 1990 but dropped to 6.5% in 2000. However, the 75 to 84 group continued to increase to 4.4%, and the 85 and over group rose to 1.5% in 2000, which was the highest figure for this group.