IELTS Writing Task 1 · Bar chart

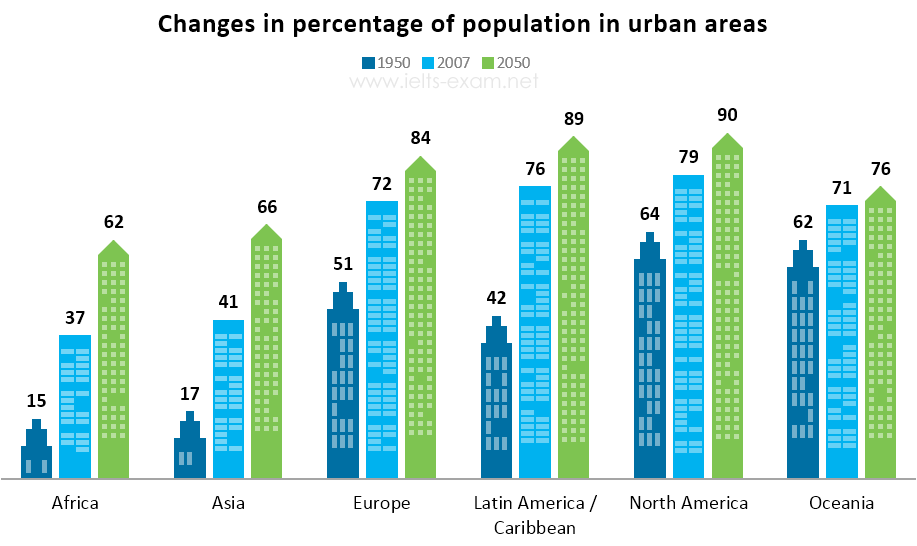
Bài mẫu IELTS Writing Task 1: The bar chart below gives information about the percentage of the population living in urban areas in different parts of the world.

Biểu đồ cột 20 phút · tối thiểu 150 từ Bài mẫu 6.0 Bài mẫu 7.0 Bài mẫu 9.0 trong app

Đề bài

The bar chart below gives information about the percentage of the population living in urban areas in different parts of the world.

Summarise the information by selecting and reporting the main features, and make comparisons where relevant.

IELTS Writing Task 1 Bar chart: The bar chart below gives information about the percentage of the… Viết ít nhất 150 từ trong khoảng 20 phút.

Dàn ý gợi ý cho dạng Bar chart

Xem tất cả đề dạng Bar chart →

Biểu đồ cột so sánh số liệu giữa các nhóm, đôi khi qua nhiều mốc thời gian. Điểm mấu chốt là nhóm số liệu để so sánh, không mô tả từng cột.

  1. Mở bàiParaphrase đề: biểu đồ cho thấy gì, ở đâu, khi nào. Không chép nguyên câu đề.
  2. Overview2 câu nêu đặc điểm nổi bật nhất: nhóm cao nhất/thấp nhất, xu hướng chung. Không đưa số liệu chi tiết.
  3. Thân bài 1Nhóm các cột có điểm chung (cùng tăng, cùng cao…), so sánh kèm số liệu cụ thể.
  4. Thân bài 2Nhóm còn lại hoặc các điểm ngoại lệ, tiếp tục so sánh bằng số liệu.
  • Dùng cấu trúc so sánh: higher than, twice as many as, the largest proportion of.
  • Mỗi đoạn thân bài nên có 3–4 số liệu, đừng liệt kê hết.
  • Chú ý đơn vị: %, million, tonnes.

Bài mẫu band 6.0

173 từ. Bài đủ ý, bố cục rõ, từ vựng và ngữ pháp ở mức an toàn: đây là mức nhiều bạn cần để đạt mục tiêu 6.0.

The bar chart shows the percentage of people living in urban areas in six parts of the world in 1950 and 2007, and the predictions for 2050.

Overall, the percentage of the urban population increased in all regions and is expected to continue increasing. North America had the highest percentage, while Africa and Asia had the lowest.

In 1950, North America and Oceania had the highest percentages of people living in cities, at 64% and 62%. Europe had 51% and Latin America and the Caribbean had 42%. In Africa and Asia, only 15% and 17% of people lived in urban areas.

In 2007, all regions had higher percentages. Latin America increased a lot to 76%, and Europe rose to 72%. Africa and Asia also increased to 37% and 41%. By 2050, the figures are expected to be even higher. North America will reach 90% and Latin America will be 89%. Africa and Asia will increase to 62% and 66%, which is the biggest growth, while Oceania will only rise a little to 76%.

Bài mẫu band 7.0

198 từ. So với bài 6.0: lập luận sâu hơn, từ vựng chính xác và đa dạng hơn, câu phức dùng tự nhiên hơn.

The bar chart compares the proportion of the population living in urban areas in six regions of the world in 1950 and 2007, along with projections for 2050.

Overall, urbanisation increased in every region over the period and is expected to continue rising. North America had the most urbanised population throughout, while Africa and Asia had the lowest levels of urbanisation but are predicted to see the most significant growth.

Còn 2 đoạn của bài 7.0 và bài mẫu band 9.0

Đăng nhập miễn phí để đọc trọn bài, so sánh 3 mức band và viết thử ngay trên đề này.

Đọc tiếp trong app